
Investors looking for bargains in an expensive stock market might be better off focusing on sales growth as an indicator, based on how well software companies’ stocks have performed.
Jefferies analyst Sean Darby cited two important trends in support of the software industry in a July 19 report: An “unprecedented upswing” in U.S. capital spending by companies and “record U.S. business formation” in a tight labor market. Those trends mean increases in software subscriptions.
At first glance, software stocks as a group appear to be expensive. Here’s a comparison of the movement of forward price-to-earnings ratios (based on rolling 12-month consensus earnings estimates among analysts polled by FactSet) for the S&P 500 software industry group and the full S&P 500 Index
SPX,
over the past five years:
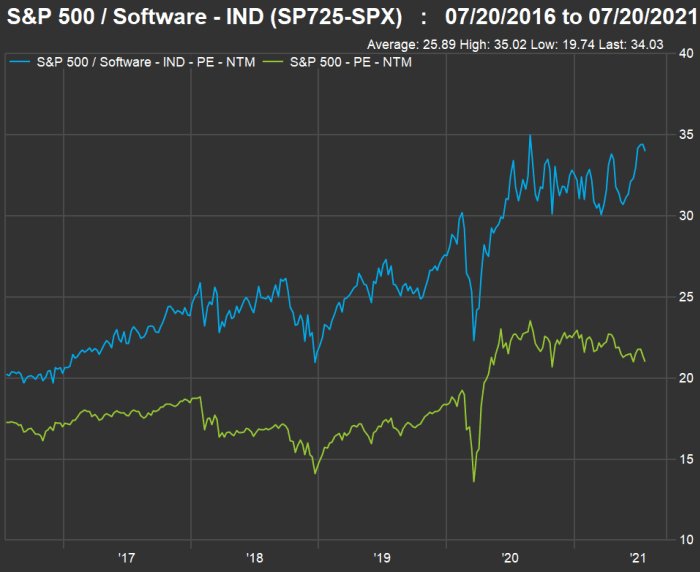
FactSet
But you get what you pay for. Before looking at sales, earnings and cash flow comparisons, check out how well the S&P 500 software industry group has performed against the full index over the past five years, with dividends reinvested:
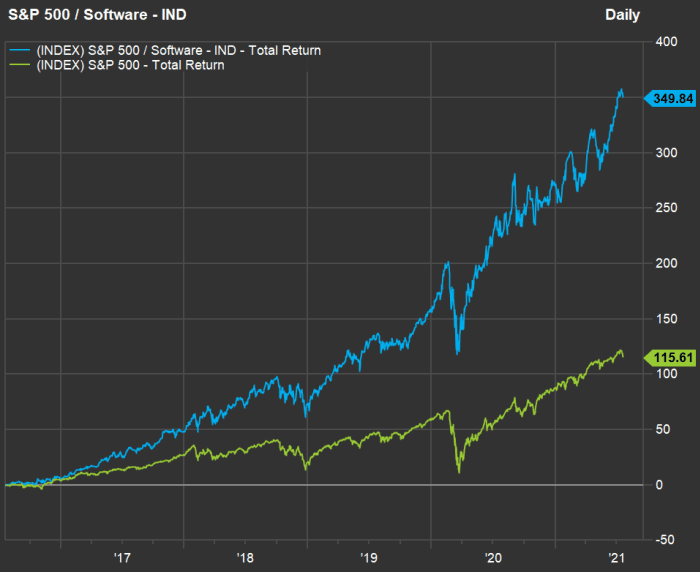
FactSet
The S&P 500 Index has done well. The software industry group is almost literally off the chart.
Looking back and looking ahead
Sales
Here’s a comparison of sales growth figures for the S&P 500 software industry group and the full S&P 500 over the past five full calendar years:
| 2020 | 2019 | 2018 | 2017 | 2016 | |
| S&P 500 Software | 11.3% | 11.3% | 17.4% | 9.6% | -2.8% |
| S&P 500 | -2.1% | 4.9% | 10.2% | 5.9% | 0.0% |
| Source: FactSet | |||||
Now let’s look ahead at aggregate sales-growth projections for 2021 and the next two years, based on consensus sales-per-share estimates:
| 2021 | 2022 | 2023 | |||
| S&P 500 Software | 14.6% | 12.8% | 9.8% | ||
| S&P 500 | 13.0% | 6.5% | 4.8% | ||
| Source: FactSet | |||||
Earnings
Here’s a look at the growth of earnings per share for the S&P 500 software industry group and the full index over the past five years.
| 2020 | 2019 | 2018 | 2017 | 2016 | |
| S&P 500 Software | 21.9% | 102.5% | -21.1% | 35.4% | -9.8% |
| S&P 500 | -17.5% | 3.8% | 19.4% | 11.1% | -1.3% |
| Source: FactSet | |||||
Here are aggregate EPS estimates for 2021 and the following two years, based on consensus estimates:
| 2021 | 2022 | 2023 | |||
| S&P 500 Software | 16.8% | 12.1% | 8.8% | ||
| S&P 500 | 38.7% | 10.8% | 8.9% | ||
| Source: FactSet | |||||
Free cash flow
A company’s free cash flow is its remaining cash flow after planned capital expenditures. It is money that can be used for business expansion, acquisitions, share buybacks, dividend increases or other corporate purposes.
Here are comparisons of increases in aggregate free cash flow per share for the two groups over the past five years, based on consensus estimates:
| 2020 | 2019 | 2018 | 2017 | 2016 | |
| S&P 500 Software | 17.9% | 14.8% | 8.6% | 20.1% | 12.0% |
| S&P 500 | 9.2% | 6.6% | 14.5% | 7.3% | 15.2% |
| Source: FactSet | |||||
And here are projections for increases in annual free cash flow per share through 2023:
| 2021 | 2022 | 2023 | |||
| S&P 500 Software | 18.0% | 12.3% | 12.3% | ||
| S&P 500 | 27.0% | 15.7% | 8.8% | ||
| Source: FactSet | |||||
There are vagaries in the data — a very large company’s earnings results can be distorted for any one year because of one-time items, and those can skew results for an industry group.
You can also see higher expectations for the recovery year of 2021 for the full index. Then again, the S&P 500’s sales and earnings declined during 2020, while those items were positive for the software industry. The trend is clear. The software industry has been on a rapid growth path for a long time and is expected to stay the course.
Software stock screens
The Jefferies report on July 19 included a list of 13 software companies, with seven unrated by the firm, a “hold” rating on Oracle Corp.
ORCL,
and “buy” ratings for five companies (in alphabetical order): Adobe Inc.
ADBE,
Citrix Systems Inc.
CTXS,
Intuit Inc.
INTU,
Microsoft Corp.
MSFT,
and Salesforce.com Inc.
CRM,
There are only 13 software companies in the S&P 500, according to FactSet. The group excludes internet software and services companies, such as Facebook Inc.
FB,
Alphabet Inc.
GOOG,
and Netflix Inc.
NFLX,
In order to broaden the list and make sure it included the 13 companies in the Jefferies list, we began our screen with the S&P Composite 1500 Index
SP1500,
(made up of the S&P 500, the S&P 400 Mid Cap Index
MID,
and the S&P Small Cap 600 Index
SML,
) and the Nasdaq-100 index (which is tracked by the Invesco QQQ Trust
QQQ,
). This yielded a list of 42 software companies.
Sales growth projections
Starting with our list of 43 software companies, here are the 10 expected to show the best sales growth over the next three years (among the 33 companies for which the consensus estimates are available).
| Company | Estimated increase in sales from 2020 through 2023 | Estimated sales – 2023 | Estimated sales – 2022 | Estimated sales – 2021 | Sales – 2020 |
|
Sabre Corp. SABR, |
174% | $3,657 | $2,911 | $1,808 | $1,334 |
|
Okta Inc. Class A OKTA, |
163% | $2,134 | $1,642 | $1,189 | $813 |
|
DocuSign Inc. DOCU, |
141% | $3,372 | $2,603 | $1,999 | $1,401 |
|
Zoom Video Communications Inc. Class A ZM, |
129% | $5,546 | $4,717 | $3,879 | $2,420 |
|
Paycom Software Inc. PAYC, |
85% | $1,555 | $1,269 | $1,018 | $841 |
|
Paylocity Holding Corp. PCTY, |
73% | $1,011 | $853 | $703 | $584 |
|
NetEase Inc. ADR NTES, |
72% | $18,394 | $16,085 | $13,642 | $10,673 |
|
Salesforce.com Inc. CRM, |
70% | $35,679 | $30,614 | $25,567 | $20,930 |
|
Ceridian HCM Holding Inc. CDAY, |
70% | $1,433 | $1,170 | $1,003 | $843 |
|
Baidu Inc ADR Class A BIDU, |
68% | $26,112 | $22,853 | $19,788 | $15,513 |
| Source: FactSet | |||||
All estimates are in millions and are for calendar years (as many companies have fiscal years that don’t match the calendar).
You can click on the tickers for more about each company.
Here’s a summary of price ratios and analyst sentiment for this group of expected rapid sales growers:
| Company | Forward P/E | Forward price/ sales | Share “buy” ratings | Closing price – July 19 | Consensus price target | Implied 12-month upside potential |
|
Sabre Corp. SABR, |
N/A | 1.7 | 25% | $10.92 | $12.75 | 17% |
|
Okta Inc. Class A OKTA, |
N/A | 24.5 | 65% | $241.35 | $274.95 | 14% |
|
DocuSign Inc. DOCU, |
170.1 | 26.6 | 76% | $289.48 | $278.28 | -4% |
|
Zoom Video Communications Inc. Class A ZM, |
79.8 | 25.2 | 46% | $354.20 | $412.63 | 16% |
|
Paycom Software Inc. PAYC, |
81.7 | 20.1 | 69% | $367.40 | $424.86 | 16% |
|
Paylocity Holding Corp. PCTY, |
100.8 | 14.7 | 59% | $192.34 | $205.53 | 7% |
|
NetEase Inc. ADR NTES, |
26.8 | 5.7 | 86% | $112.25 | $134.13 | 19% |
|
Salesforce.com Inc. CRM, |
66.4 | 8.2 | 81% | $237.55 | $279.56 | 18% |
|
Ceridian HCM Holding Inc. CDAY, |
264.2 | 13.8 | 53% | $95.65 | $105.93 | 11% |
|
Baidu Inc ADR Class A BIDU, |
19.5 | 3.1 | 86% | $176.45 | $310.92 | 76% |
| Source: FactSet | ||||||
For Sabre Corp. and Okta Inc., no forward P/E ratios are available because they are expected to post net losses for at least the next four quarters. For comparison, aggregate forward P/E ratios are 34 for the S&P 500 software industry group and 21.1 for the full S&P 500. Aggregate forward price-to-sales ratios are 10.5 for the S&P 500 software group and 2.7 for the full S&P 500.
Keep in mind that Wall Street analysts are really focused on short periods — a 12-month price target may not mean very much when selecting stocks for growth over a period of many years.
Analysts’ favorite software stocks
Here are the 10 software stocks with the highest percentages of “buy” or equivalent ratings among analysts polled by FactSet:
| Company | Share “buy” ratings | Closing price – July 19 | Consensus price target | Implied 12-month upside potential | Forward P/E | Forward price/ sales |
|
ACI Worldwide Inc. ACIW, |
100% | $34.86 | $45.40 | 30% | 30.7 | 3.1 |
|
Progress Software Corp. PRGS, |
100% | $44.02 | $56.60 | 29% | 13.2 | 3.7 |
|
SailPoint Technologies Holdings Inc. SAIL, |
92% | $47.60 | $64.31 | 35% | N/A | 10.5 |
|
Microsoft Corp. MSFT, |
92% | $277.01 | $297.98 | 8% | 34.5 | 11.6 |
|
CommVault Systems Inc. CVLT, |
88% | $77.11 | $81.83 | 6% | 31.7 | 4.7 |
|
Baidu Inc. ADR Class A BIDU, |
86% | $176.45 | $310.92 | 76% | 19.6 | 3.1 |
|
NetEase Inc. ADR NTES, |
86% | $112.25 | $134.13 | 19% | 26.7 | 5.6 |
|
Adobe Inc. ADBE, |
81% | $602.05 | $628.55 | 4% | 47.2 | 17.3 |
|
Synopsys Inc. SNPS, |
81% | $274.48 | $312.00 | 14% | 40.9 | 10.0 |
|
Salesforce.com Inc. CRM, |
81% | $237.55 | $279.56 | 18% | 66.6 | 8.2 |
| Source: FactSet | ||||||
Finally, here are sales growth projetions for this group of 10 software stocks favored by analysts:
| Company | Estimated increase in sales from 2020 through 2023 | Estimated sales – 2023 | Estimated sales – 2022 | Estimated sales – 2021 | Sales – 2020 |
|
ACI Worldwide Inc. ACIW, |
18% | $1,530 | $1,397 | $1,331 | $1,294 |
|
Progress Software Corp. PRGS, |
N/A | N/A | $541 | $532 | $446 |
|
SailPoint Technologies Holdings Inc. SAIL, |
56% | $571 | $473 | $409 | $365 |
|
Microsoft Corp MSFT, |
41% | $216,606 | $198,789 | $176,548 | $153,284 |
|
CommVault Systems Inc. CVLT, |
23% | $857 | $807 | $756 | $697 |
|
Baidu Inc. ADR Class A BIDU, |
68% | $26,112 | $22,853 | $19,788 | $15,513 |
|
NetEase Inc. ADR NTES, |
72% | $18,394 | $16,085 | $13,642 | $10,673 |
|
Adobe Inc. ADBE, |
59% | $20,899 | $18,302 | $15,890 | $13,142 |
|
Synopsys Inc. SNPS, |
30% | $4,916 | $4,518 | $4,140 | $3,775 |
|
Salesforce.com Inc. CRM, |
70% | $35,679 | $30,614 | $25,567 | $20,930 |
| Source: FactSet | |||||
Don’t miss: 19 dividend stocks to help you combat inflation