
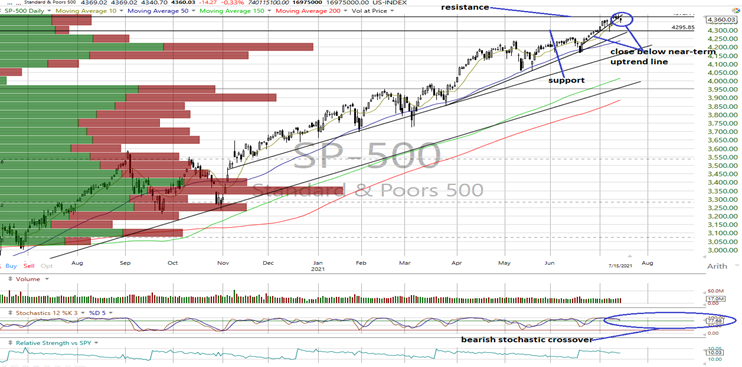
While two of the equity indices advanced Thursday, the S&P 500 closed below its near-term uptrend line, shifting its trend to neutral from positive. Also troubling, market breadth deteriorated further leaving all the indices in near-term downtrends.
And while oversold conditions could possibly offer a pause in recent weakness, psychology remains cautionary with an excess of bullish sentiment while insiders have a tepid interest in buying their stock at these levels.
On the Charts
Source: Worden
Of the major equity indices only the DJIA and Dow Jones Transports managed to post gains Thursday while market breadth remained negative.
Meanwhile, the charts saw the S&P 500 closed below its near-term uptrend line and is now neutral as are the MidCap 400 and Value Line Arithmetic Index.
The Dow Transports and Russell 2000 remain in near-term downtrends.
Regarding breadth, the cumulative advance/decline line for the NYSE turned negative, joining the All Exchange and Nasdaq in that regard.
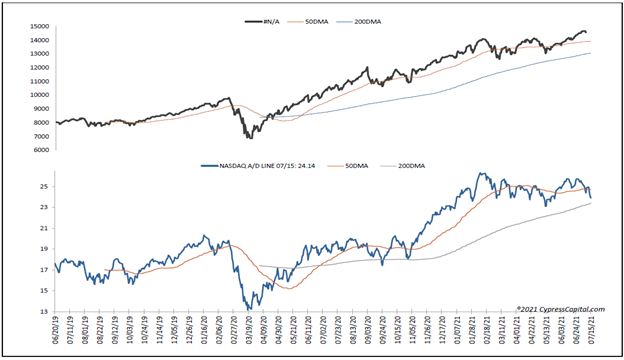
What may be most troubling is the negative divergence between the uptrend of the Nasdaq Composite while the Nasdaq A/D remains in a downtrend as it continues to make lower lows. Divergences like this typically result in some form of market correction.
The NASDAQ cumulative advance/decline line is negative and below its 50 DMA.
Also, the S&P and Nasdaq 100 gave bearish stochastic crossover signals.
Market Data
All the McClellan 1-Day Overbought/Oversold are in oversold territory (All Exchange: -78.34 NYSE: -70.33 Nasdaq: -83.53). They may offer some pause of recent weakness at these levels.
However, the Rydex Ratio (contrarian indicator), measuring the action of the leveraged ETF traders, remains bearish at 1.3 as they remain leveraged long.
Also this week’s contrarian AAII bear/bull ratio (23.33/43.07) moved back into mildly bearish territory while the Investors Intelligence Bear/Bull Ratio (contrary indicator) saw a decline in bears and a lift in bulls, remaining bearish at 15.5/60.8. It continues to suggest an excess of bullish expectations, in our opinion.
The Open Insider Buy/Sell Ratio moved back to a neutral 26.1 but still shows a lack of appetite for insiders to buy their own stock at these levels.
Valuation and Treasury Yields
The forward 12-month consensus earnings estimate for the S&P 500 from Bloomberg has lifted to $199.28 per share. As a result, the S&P’s forward P/E multiple is 21.9x with the “rule of 20” finding fair value at approximately18.7x. T
The S&P’s forward earnings yield is 4.57%.
The 10-year Treasury yield closed lower at 1.3% and remains an important factor. We view support as 1.2% and resistance at 1.44%. We suspect the drop in yield of late may be the result of a “flight to safety”.
Near-Term Outlook
The combination of poor underlying breadth, chart divergences, and psychology data suggest a higher degree of caution is now warranted as the potential for a correction increases. Selectivity continues to intensify.
Get an email alert each time I write an article for Real Money. Click the “+Follow” next to my byline to this article.