
The market rotation appears to be continuing.
Two of the major market indices closed higher with one making a new closing high Thursday as the charts saw a combination of positive and negative events as cumulative breadth deteriorated slightly.
Meanwhile, the data was little changed with investor psychology suggesting the “wall of worry” is still in need of further repair despite recent market weakness.
Given the bifurcated action of the indices as market rotation persists, it is more difficult to have a “macro-outlook.”
On the Charts
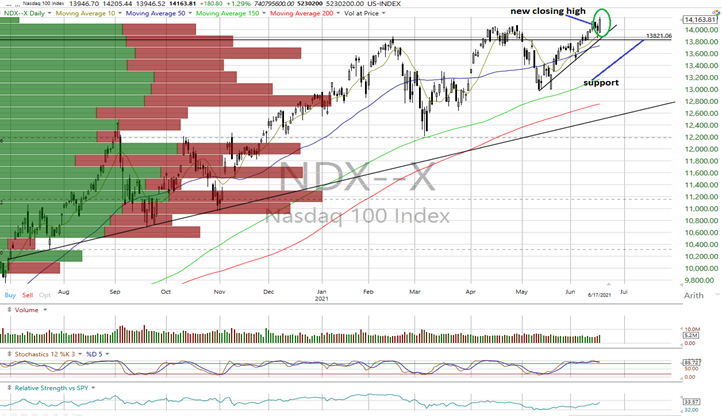
Source: Worden
The major equity indices closed mostly lower Thursday with negative internals on the NYSE with the Nasdaq having negative breadth but positive up/down volume.
Once again, we saw bifurcated action on the charts.
On the negative side, the Dow Jones Transports and MidCap 400 closed below support with the MidCap trend turning near-term negative.
Both the Russell 2000 and Value Line Arithmetic Index closed below their near-term uptrend lines and are now neutral.
At the other end of the spectrum, The Nasdaq 100 (see above) made a new closing high while the Nasdaq Composite closed higher and just 13 points of a new closing high.
As a whole, the action suggests market rotation is continuing.
The trends are negative on the DJIA, Dow Transports and MidCap 400; neutral for the S&P 500, Russell 2000 and Value Line index; and in uptrends for the Nasdaq Composite and Nasdaq 100.
Market breadth weakened a bit further. While the All-Exchange cumulative A/D remains positive, the NYSE’s is now negative and the Nasdaq’s neutral.
The S&P gave a bearish stochastic crossover signal.
Market Data
The McClellan 1-Day Overbought/Oversold Oscillators remain neutral (All Exchange: -21.85 NYSE: -43.29 Nasdaq: -4.4).
The Rydex Ratio (contrarian indicator), measuring the action of the leveraged ETF traders, dipped to 1.35 but remains in bearish territory.
This week’s contrarian AAII bear/bull ratio (22.31/40.24) turned mildly bearish as bears declined while bulls increased. This was also the case for the Investors Intelligence Bear/Bull Ratio (contrary indicator) at 16.2/54.5, which remains on a bearish signal.
The Open Insider Buy/Sell Ratio inched up to 20.9 but remains bearish.
S&P Valuation
Valuation continues to appear extended with the forward 12-month consensus earnings estimate for the S&P 500 from Bloomberg rising to $191.92 per share. The S&P’s forward P/E multiple is 22.0x with the “rule of 20” finding fair value at 18.5x. The valuation spread has been consistently wide over the past several months while the forward estimates have risen rather consistently.
The S&P’s forward earnings yield is 4.55%%.
The 10-year Treasury yield dropped to 1.51%. We view support at 1.5% and resistance at 1.6%. We continue to believe the moves in the 10-year yield may well have the greatest influence over the near-term action on the equity indices.
Near-Term Outlook
We are going to keep our “neutral/positive” outlook in place for now as growth appears to be retaking the field.
Get an email alert each time I write an article for Real Money. Click the “+Follow” next to my byline to this article.